
1
Current yield
A value in t/ha. Its colour shows how the current yield compares with the field average: green, orange or red.


Devices 01 · field testing
A Polish yield monitor for combine harvesters. The operator sees the current yield on the ISOBUS terminal in the cab, and successive passes build up a yield map of the whole field.
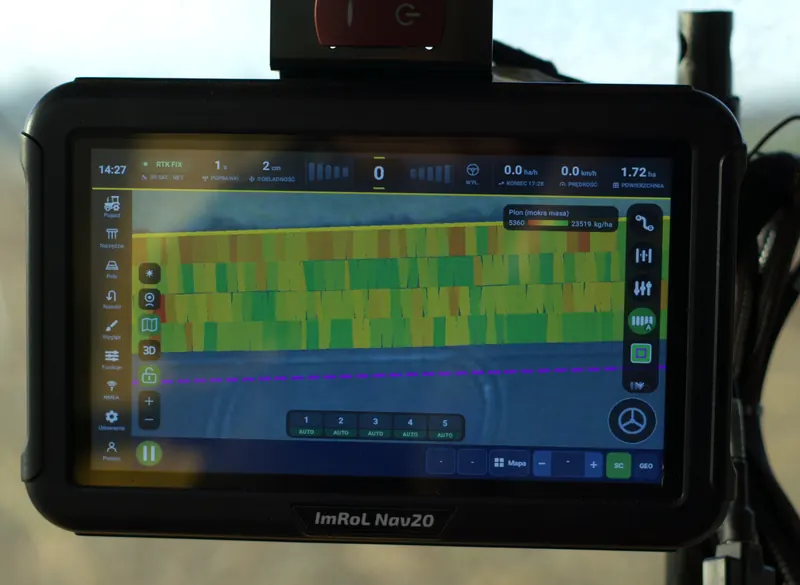
Yield map visualisation
01 · Features
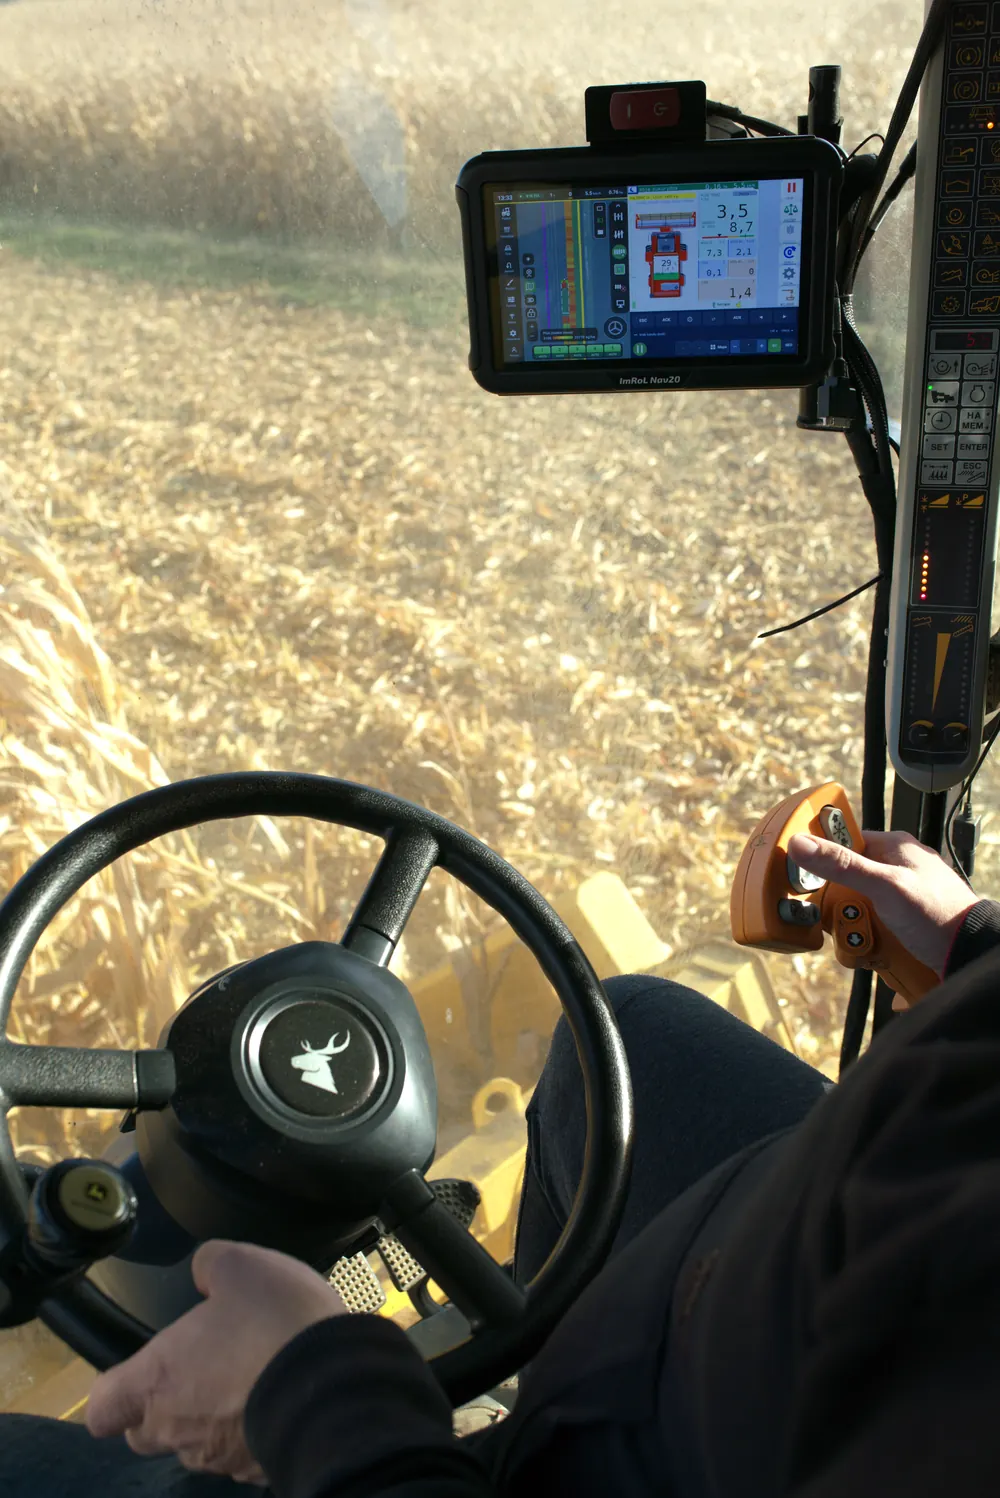
A module installed in the combine measures the flow of grain into the tank and shows the results on the terminal in the cab. The photo was taken during the maize harvest; the numbers mark the individual functions.
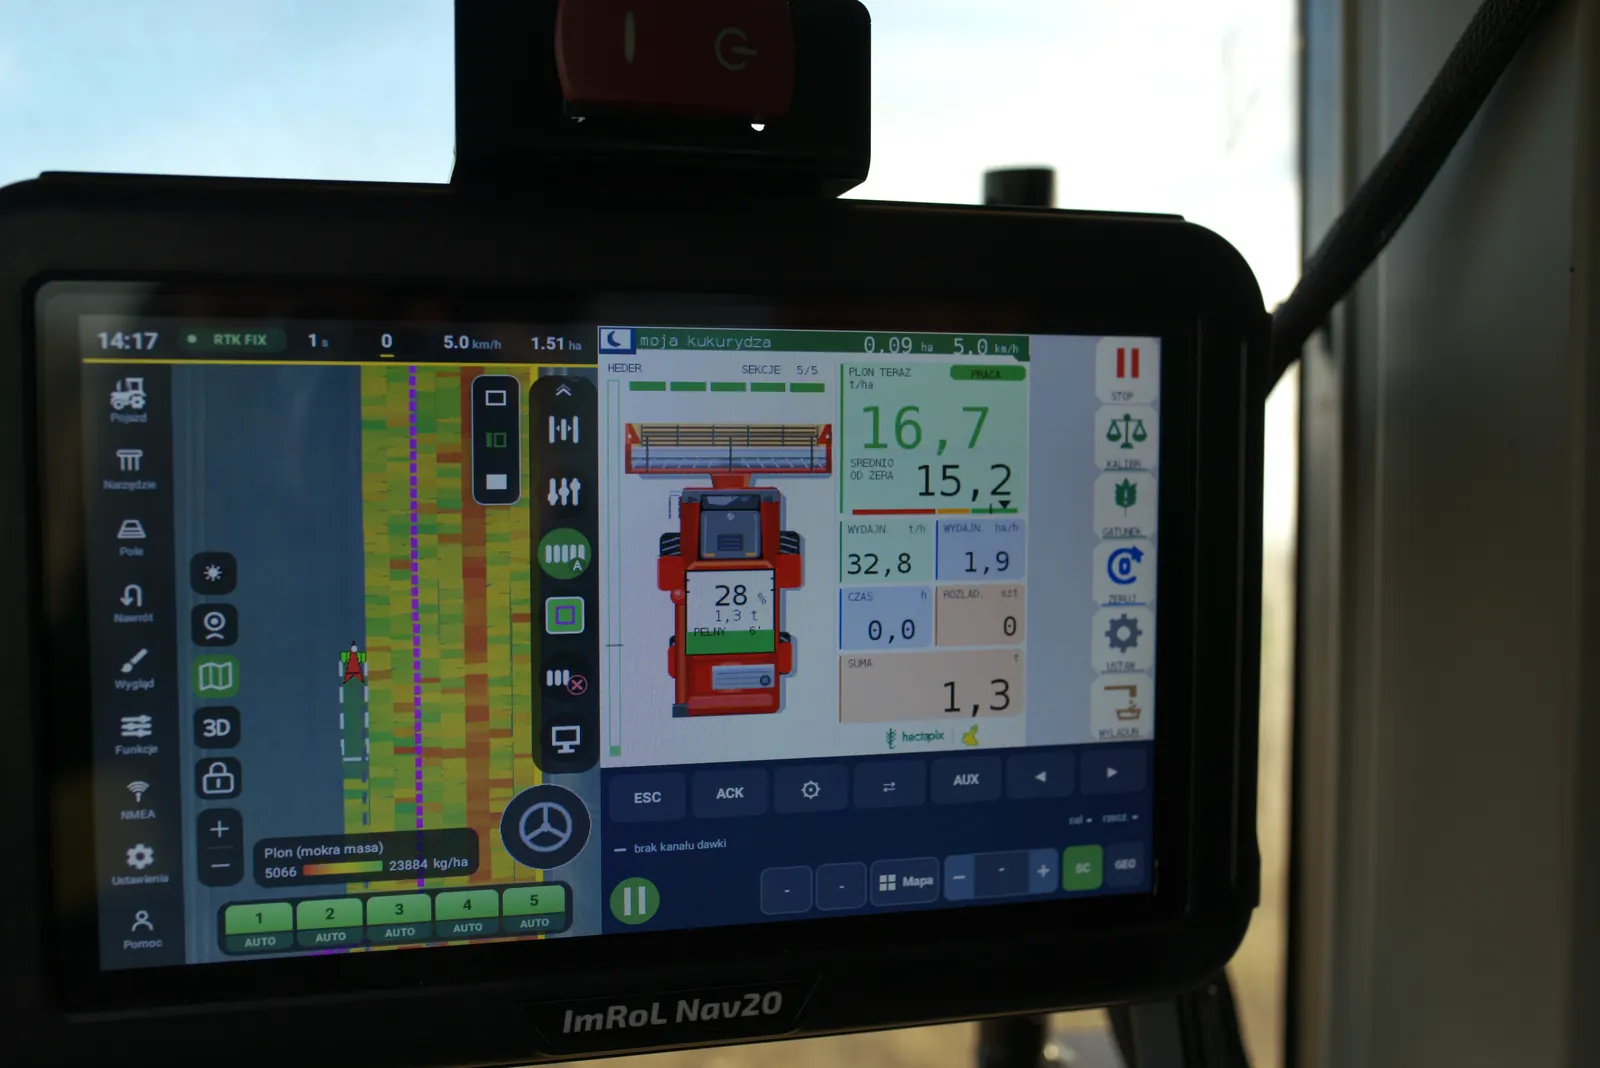
A value in t/ha. Its colour shows how the current yield compares with the field average: green, orange or red.
Measurement starts when the header is lowered and stops when it is raised at the headland, with no input from the operator.
Fill level in percent and tonnes, plus the estimated time until the tank is full.
The number of times the grain tank has been unloaded.
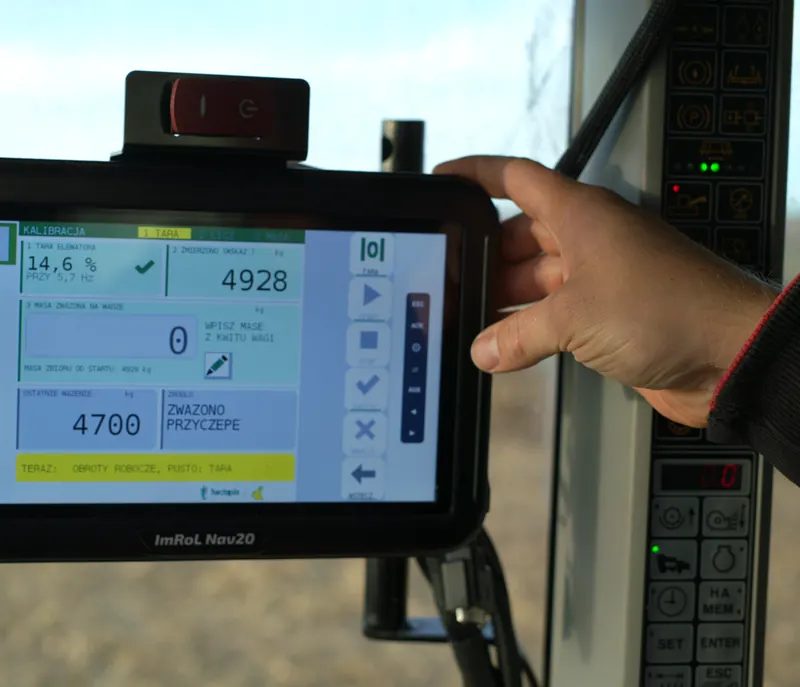
The trailer weight from the weighbridge ticket is entered on the terminal and the monitor corrects its measurement. One weighing per crop is enough.
Data is sent to the navigation terminal in real time, which builds the yield map pass by pass.
Works with ISOBUS terminals (ISO 11783): Virtual Terminal and Task Controller. Tested on the ImRoL Nav20 terminal.
The product is in field testing. In the 2026 season it worked during the maize harvest. We will announce its availability on this website.
Testing was carried out on the ImRoL Nav20 terminal in cooperation with Tanie Nawigowanie (tanienawigowanie.pl). We thank them for their cooperation and support during the tests.
02 · Yield map
The monitor measures yield during harvest and records it together with the position of the combine. With every pass, a strip of cells is added to the map, coloured by yield: green where the yield is high, yellow and red where it is lower.
Once the harvest is over, the map covers the whole field. Areas of higher and lower yield form zones that make it easier to plan sowing and fertilising and, in turn, to reduce the cost of fertiliser and seed.
03 · From the field
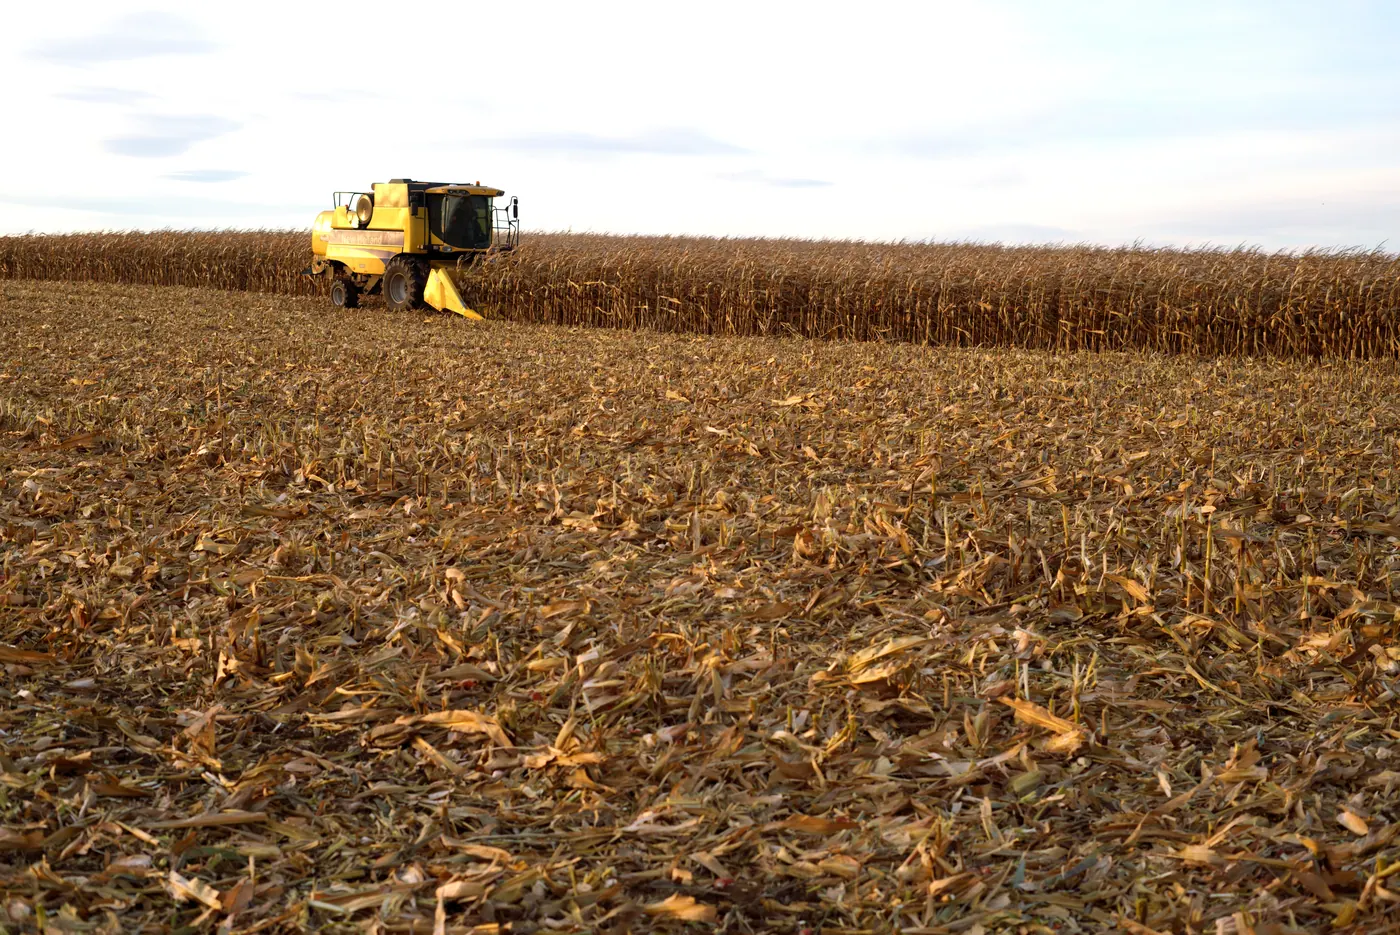
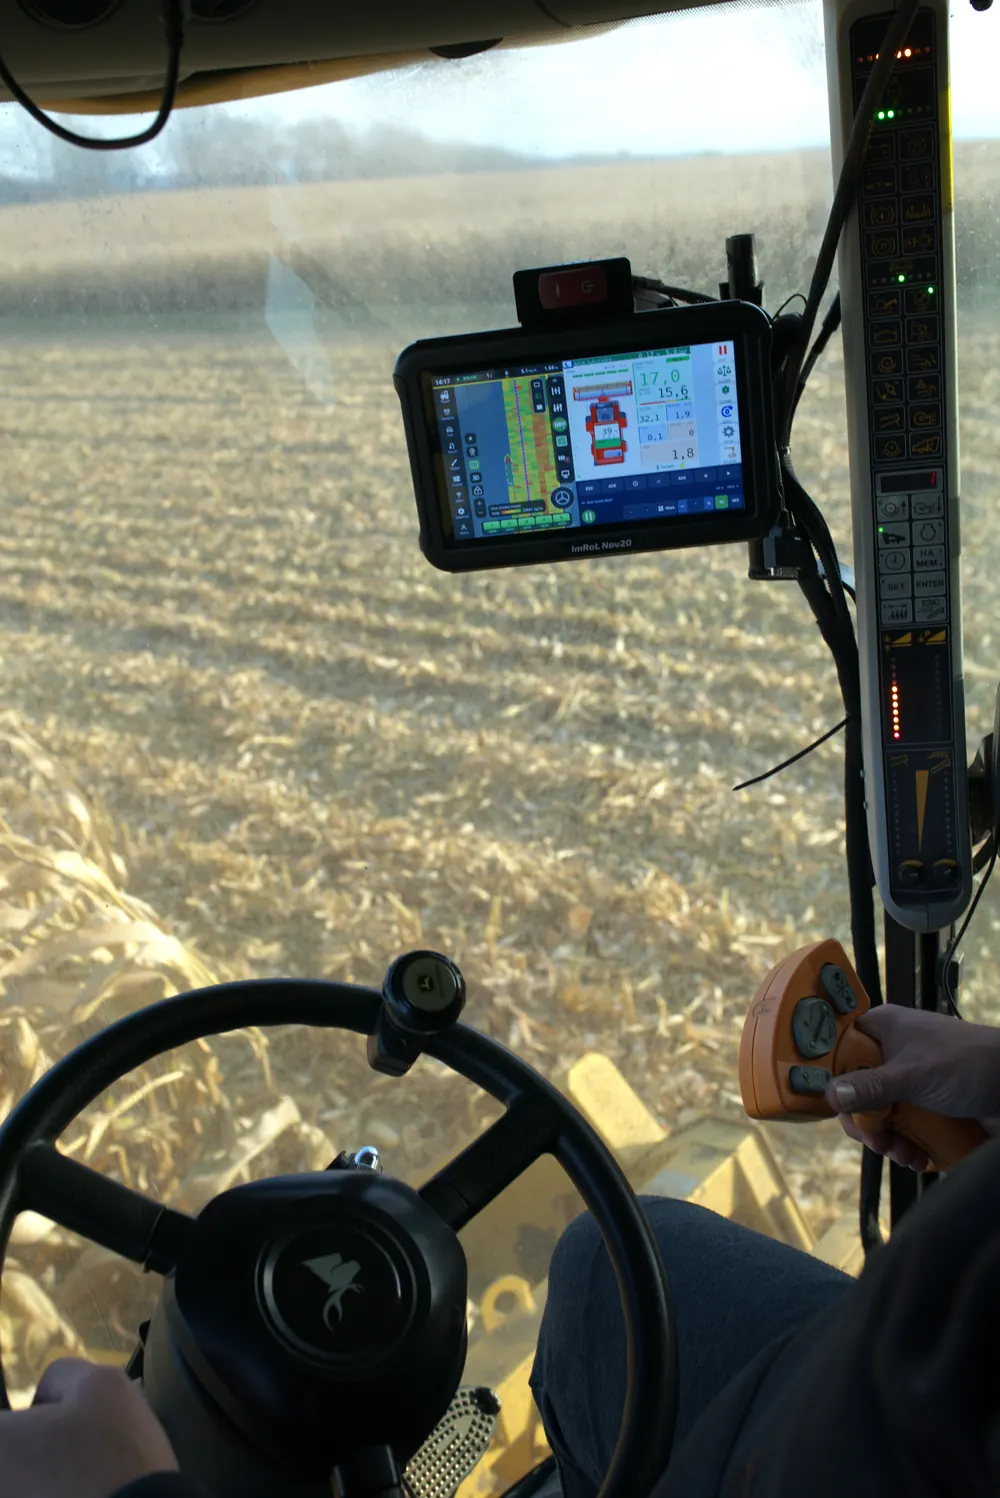
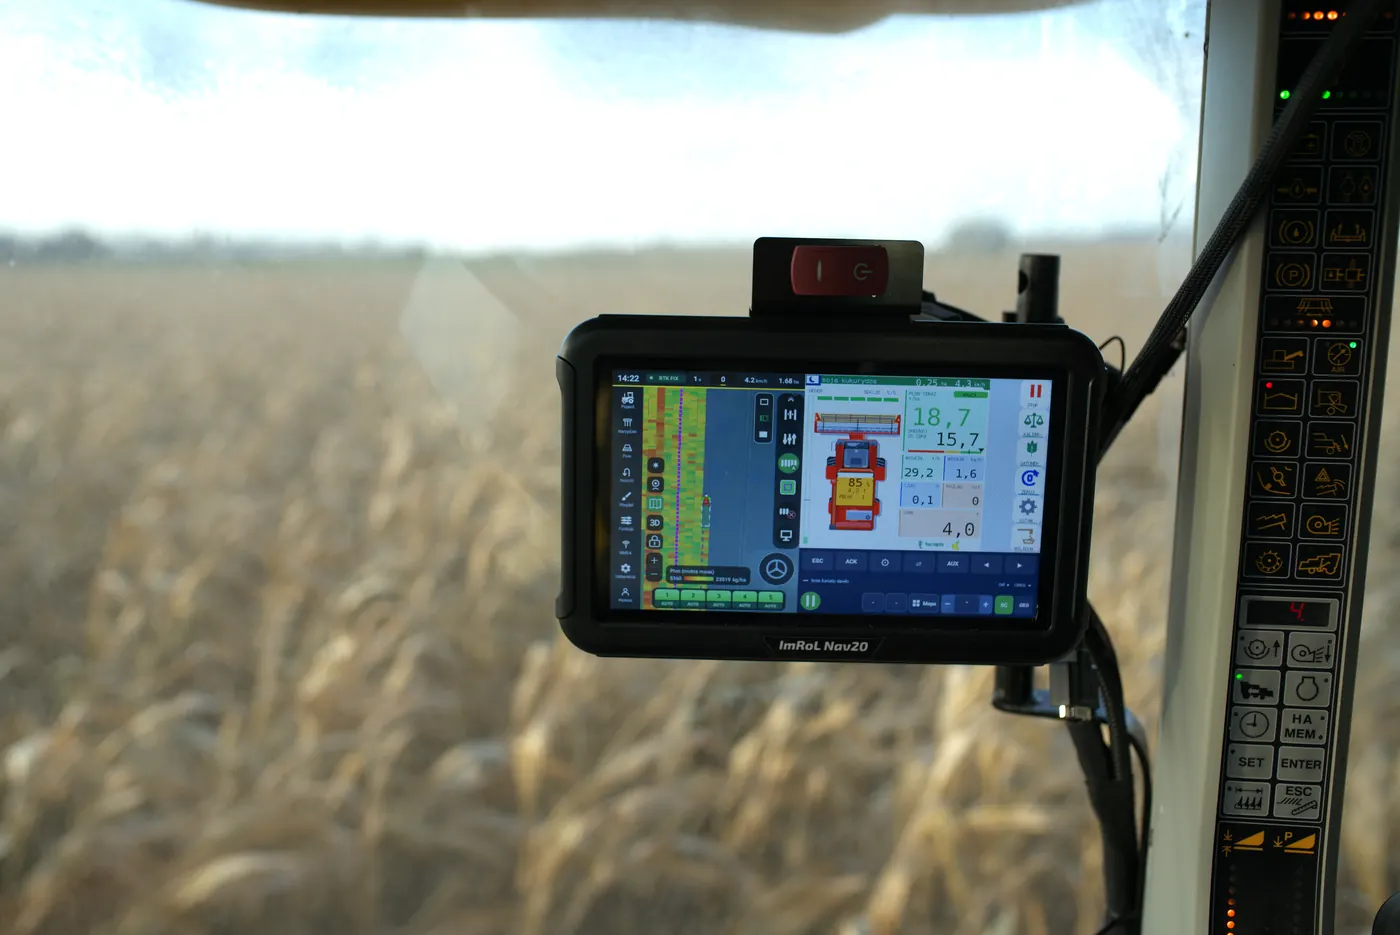
Photos from testing the monitor during this year's harvest.
For machine makers
Electronics, software, screens on the ISOBUS terminal and field testing. Tell us what your machine needs, and we will stay in touch at every stage.